Responsible investment
The materiality assessment above indicates that responsible investment is one of the key issues in the area of sustainability. Bellevue is striving for full and comprehensive integration of ESG criteria at the investment process and investment portfolio levels while remaining compliant with the constantly growing regulatory requirements.
Various sustainability approaches have been embedded into our ESG framework, which we have systematically implemented and are continuously developing.

Bellevue’s ESG investment guidelines basically comprise the following elements:
Exclusion criteria based on norms and values
We are committed to adhering to internationally recognized norms and systematically exclude from the managed investment portfolios any companies that seriously violate human rights, the environment or labor norms, or are involved in corruption. To this end, we apply the MSCI ESG controversies methodology and standards. MSCI ESG Controversies is intended to reflect all areas of adverse impact covered by the Organisation for Economic Co-operation and Development’s (OECD) Guidelines for Multinational Enterprises on Responsible Business Conduct. In addition, MSCI ESG Research provides a mapping of ESG controversy cases to the underlying principles of the following global norms: the UN Global Compact (UNGC), the UN General Principles of Business and Human Rights (UNGP) and the International Labor Organization (ILO) Conventions (both core and broad).
MSCI ESG Research has a dedicated team of analytical staff who identify and assess the severity of controversy cases that involve companies in its coverage universe on an ongoing basis. ESG analytical staff review the reported allegations and apply consistent scoring and a color-coded flag for each controversy case, based on the severity of impact in each case, the alleged role of the company in each case and the status of each case (which is determined by the state of resolutions, if any, between involved stakeholders). MSCI ESG Controversies – evaluation framework:

In contrast to exclusions based on violations of global principles and standards, value-based exclusions are based on social, ethical or moral values. Thresholds have been defined for the percentage of overall revenues that can be generated from business areas with high ESG risk scores such as conventional weapons, thermal coal and tobacco production. Companies that exceed the generally accepted annual revenue thresholds in the business areas below are excluded:
Business area | Revenue threshold | |
Controversial weapons | 0% | |
Conventional weapons | 10% | |
Thermal coal | 5% | |
Fracking/oil sands | 5% | |
Production of tobacco | 5% | |
Sale of tobacco | 20% | |
Adult entertainment | 5% | |
Gambling | 5% | |
Palm oil | 5% |
The revenue thresholds are unchanged from the prior-year period.
Compliance with these revenue thresholds is systematically reviewed, even though in the case of most of Bellevue’s investment products – particularly in the healthcare sector – there is no involvement in these business areas. The specified revenue thresholds serve primarily for the practical implementation of the exclusion criteria and are based on empirical values in collaboration with institutional investors and industry experts. More far-reaching and/or stringent exclusion criteria may be applied for individual strategies with a dedicated sustainability focus.
Bellevue maintains an exclusion list, which is monitored and updated on a quarterly basis. Based on this list, just over 900 companies from across our investment universe were excluded from direct investment as at the end of 2023. Compliance with exclusion criteria is monitored monthly by an internal risk management unit.
ESG integration
As a specialist investment boutique with largely autonomous investment desks, the implementation of ESG integration policy is largely the responsibility of the respective portfolio management teams, although certain higher-level ESG activities are also carried out by ESG specialists assigned to the central product management function. Environmental, social and governance factors are integrated into the fundamental analysis of every company through an ESG integration process in which the associated financial risks or opportunities are evaluated with respect to future stock market performance. This approach gives our portfolio managers a holistic picture of an enterprise.
The environment subcategory focused on aspects such as whether a company systematically measures and discloses its emissions or carbon intensity or such as monitoring the CO2 intensities of companies in the context of the average value for the relevant industry. The Social subcategory covers aspects such as product quality, data privacy policies, employee development and gender balance/diversity at management level. Examples of Governance issues are board independence, board compensation and corporate ethics.
A system of ESG ratings forms the basis by which sustainability criteria are integrated into the asset manager's investment decision process. Every issuer of securities in our investment universe is assigned an ESG rating based on various subscores. These scores are based on data from independent third-party providers MSCI ESG Research and Morningstar Sustainalytics. Their relevance, and consequently their weightings, can vary sharply depending on the sector in question. When calculating ESG scores, there is a special focus on so-called key ESG issues, i.e., on those sustainability aspects where a company excels or performs particularly poorly, as the case may be.
Despite the continuous improvement and adaptation of ESG rating methodologies, aggregated ESG ratings still had to be interpreted with caution and a critical eye during the past year. Most ESG rating methods are based on a predefined systematic approach that does not always result in an objective or «fair» assessment of risks. In fact, such methods often systematically disadvantage start-ups and small-cap companies relative to large-cap companies. A lack of manpower and experience in handling ESG issues can result in a company being underrated. Also, the given comparison group used to determine ESG ratings within a certain industry may not be entirely applicable. That is why our portfolio managers always take a closer look at potential or ostensible «ESG laggards» (CCC, B rating) and reach out to the ESG specialists at our external ESG research providers and at the companies with lagging ESG ratings. Investments in «ESG laggards» must be documented in detail. Bellevue Asset Management does not apply a «best-in-class» approach for the reasons mentioned above, unless otherwise dictated by a specific investment strategy.
A breakdown of Bellevue’s liquid investment strategies (net invested assets of Bellevue’s equity and fixed income strategies excluding cash, Private Equity, Ventures, company pension fund and dedicated derivative strategies) by MSCI ESG rating is given below:
Breakdown of MSCI ESG ratings as of December 31, 2023

At the end of 2023, Bellevue’s liquid strategies were again invested primarily in companies with high to very high ESG ratings (MSCI rating of BB or higher). These MSCI ESG ratings reflect sustainability risks and opportunities. Only 3.4% (8.9% in the previous year) of all investments were in so-called ESG laggards (B) and the percentage of investments with the lowest rating of CCC was negligible (0.2%). Only 2.9% of all asset-weighted investments had no rating (compared to 3.5% in the previous year). The breakdown of ESG ratings shown above covers approximately 94% of Bellevue’s total assets under management (92% in the previous year).
Following the introduction of the EU Sustainable Finance Disclosure Regulation in March 2021 and the Delegated Regulation (EU) 2021/1253 on MiFID II sustainability preferences (art. 9), Bellevue established the two investment categories of «investments with sustainable characteristics» and «sustainable investments». In the absence of a uniform European-wide classification system, the two categories are applied in the investment processes of the respective strategies to the best of our knowledge based on current practices and the, in some cases limited, data available, in accordance with clearly defined principles.
Investments with sustainable characteristics (EU SFDR)
Most of Bellevue’s investment strategies take into account social, environmental as well as governance-related characteristics (ESG) as part of the implementation of their investment objectives, in accordance with the provisions of Article 8 of the EU Disclosure Regulation 2019/2088 (EU SFDR), but do not have sustainability as their objective. In principle, the aim is to invest all of the assets of the relevant strategies in investments with sustainable characteristics. However, as there is not yet a sufficient amount of ESG data available in every asset class and sector and, given that some companies do not yet have an ESG rating, a minimum allocation threshold to investments with sustainable characteristics has been set as a percentage of total invested fund assets.
For strategies with a considerable allocation to small and mid-cap investments and/or significant emerging market exposure where ESG research coverage is low, the minimum allocation threshold to «investments with sustainable characteristics» is 50%. Strategies that are less affected by these factors must adhere to a higher minimum allocation of 75% to «investments with sustainable characteristics».
Detailed information on the individual investment strategies as well as the methodology can be found in the product-specific documents available via the following link:
https://www.bellevue.ch/all-de/all/esg/nachhaltigkeit/nachhaltigkeit-auf-portfolioebene
Sustainable investments (MiFID II and EU SFDR)
In addition to taking into account the most important adverse effects on sustainability factors (PAIs) at portfolio level, Bellevue has defined minimum allocations to sustainable investments for every investment strategy pursuant to Article 2 (17) of the Disclosure Regulation 2019/2088. This defines a «sustainable investment» as an investment in an economic activity that contributes to the achievement of an environmental and/or social objective and do no significant harm with respect to such objectives. Furthermore, the investee companies must follow good governance practices.
Investments are included under the «sustainable investment» allocation if, firstly, they have a positive alignment with at least on of the 17 UN Sustainable Development Goals and, secondly, if they meet the aforementioned sustainability characteristics and, thirdly, if they have no significant adverse impact on sustainability factors. The MSCI ESG methodology is also used to measure contributions towards the UN SDGs (see section on «Alignment with UN SDGs»). Minimum thresholds of 25% and 50% were defined for the sustainable investment category. Here as well, the existing ESG-related research coverage and the specific investment focus (e.g. small and mid caps) play an important role.
Based on the above definitions and the methodologies applied, approximately 94% (87% in the previous year) of the liquid net invested assets at Bellevue as of December 31, 2023, qualified as «investments with sustainable characteristics» and 62% (54% in the previous year) as «sustainable investments» in the context of the EU SFDR:
Investment products with sustainable characteristics (based on EU SFDR)

Sustainable investment (based on EU SFDR)
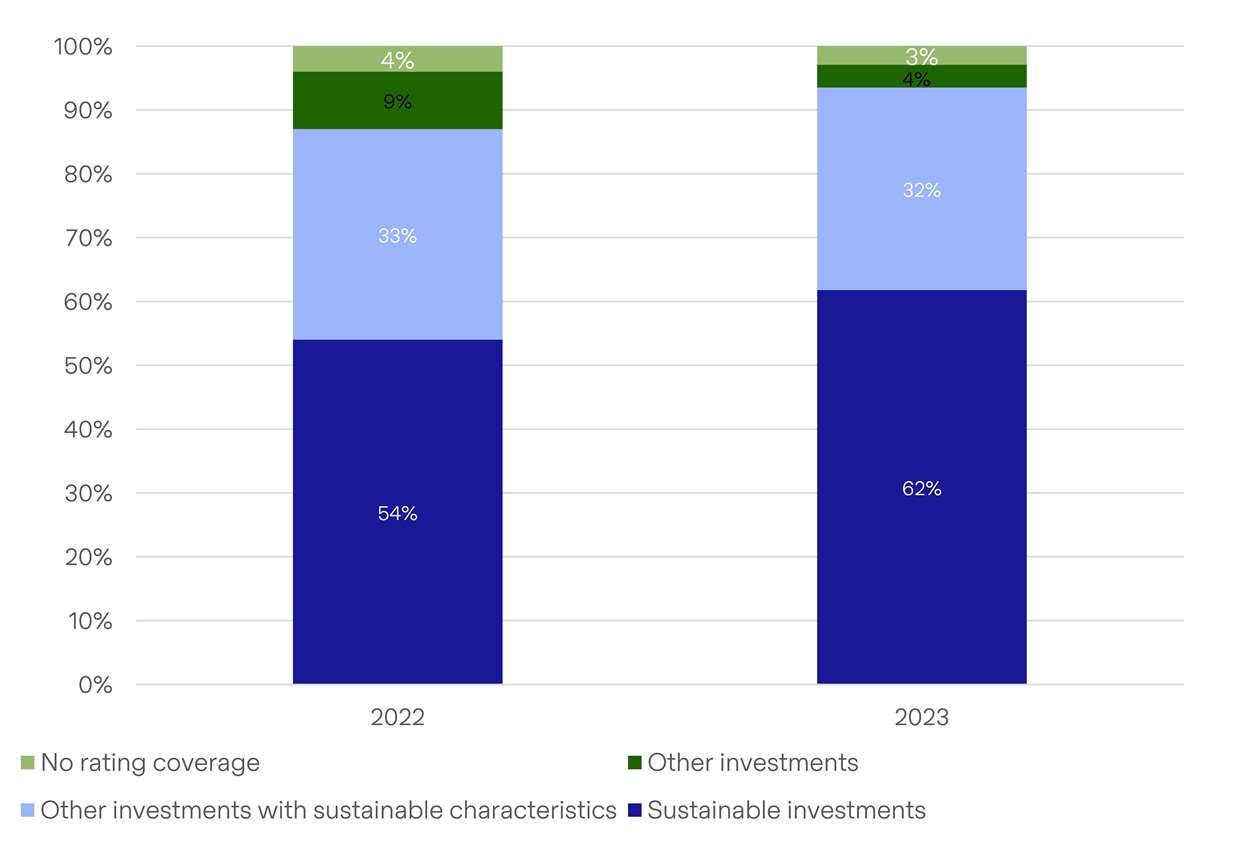
Once again, we would like to point out that an industry-wide comparison of these percentage proportions is not meaningful due to the current lack of harmonization of the applicable classification screens and evaluation methodologies within the meaning of the EU SFDR.
Principal adverse impacts on sustainability factors (PAI)
Bellevue takes into account the principal adverse impact (PAI) of its investment decisions on sustainability factors in its investment processes and portfolio management activities. PAI indicators can be considered both explicitly and implicitly. In explicit consideration, thresholds are determined for each PAI criterion, defining when a specific PAI criterion has a «principal adverse impact» on a sustainability factor ( «supercritical»). If an issuer is assessed as having a «principal adverse impact», it cannot be categorized as a sustainable investment, no matter if the issuer makes a positive contribution to one of the UN’s 17 Sustainable Development Goals.
In implicit consideration, aspects of the relevant PAI indicators are incorporated into the ESG ratings methodology developed by MSCI ESG, resulting in indirect consideration of PAI performance by defining minimum rating scores that are used to calculate the share of sustainable investments or of investments with sustainable characteristics for each investment fund.
Within the framework of a PAI analysis, sustainability factors such as carbon intensity, programs to reduce carbon emissions, water- and waste-related controversies, or gender mix at board level, for example, are explicitly taken into account.
The consideration of adverse impacts on sustainability is subject to data availability. The required data is not always available in sufficient quantity and quality for every entity in which Bellevue invests. As a result, the list of PAI indicators taken into account is continuously reviewed based on data availability and data quality.
As of December 31, 2023, 7.7% of weighted-average portfolio assets had a significantly negative PAI indicator, which resulted in a corresponding reduction in the share of «sustainable investments».
ESG stewardship
As a responsible long-term investor, Bellevue supports all measures and proposals designed to increase the value of portfolio companies over the long term in the interests of shareholders and investors. This includes engagement activities as well as the exercising of voting rights at general meetings of shareholders.
Engagement
Active management means investing with conviction. We know what we are investing in and pursue this with great discipline. At Bellevue Group you will not find any overarching investment committees or a CIO. Working independently in their own product areas, the relevant specialist teams are all committed to personal responsibility, respect, and the strength of their own vision. As well as being investment experts, our employees are simultaneously entrepreneurs who through their own investments have a stake in the success of Bellevue clients.
This commitment to active investment management also highlights the importance of engagement as a key element of our ESG framework. Portfolio managers are engaged in an active and constructive dialog with the executives and other relevant representatives of portfolio companies on environmental, social and governance issues. If there are any indications of a significant controversy related to ESG issues, they are constructively discussed with the investee company and subsequent developments (e.g. change in strategy or processes, improvement of ESG rating) documented over time. Engagement activities are undertaken in the context of materiality and proportionality considerations. The level of engagement can vary depending (among other things) on the size of the position held by an investment strategy, the market capitalization of the investee company, and the entity’s stage of corporate development.
Written records of ESG engagement activities are maintained as part of the regular documentation of conversations with company representatives. In 2022 we also established a proprietary tool in which ESG engagement activities are systematically recorded and subsequent developments documented over time. The engagement guidelines were elaborated in more detail in 2023. For example, we defined which topics are prioritized in our engagement approach. These are listed below:
Broad topics:
- Violations of international norms
- Human rights violations
- Climate change
- Serious controversies
- Business ethics
- Labor rights
- Corporate governance
- Transparency
Specific topics:
- Access to medicines
- Data protection and privacy
- Product quality and safety
- Employee satisfaction
- Human capital
- Public health
- Gender diversity
Instruments for escalation strategies were also determined. If an investee company is not making the progress we would like to see, the responsible investment manager has a range of measures at their disposal and is free to pursue the engagement action they believe is the most appropriate. Escalation measures include:
- Engagement with higher levels of management, including the non-executive directors
- Voting against management proposals at general shareholder meetings
- Collaborative engagement efforts
If no visible or measurable progress is made after 36 months of engagement, a strategic reassessment of the situation can result in:
- A «quarantine» of the investment, meaning it can no longer be increased
- A sale of the investment
Since a sale of the investment significantly reduces the potential for meaningful conversations and our influence on the company in question, we view this action as a very last resort.
Formal records of our engagement activities have been kept since 2022 and in the meantime 15 engagements have been concluded and 10 of the engagement outcomes were successful in full or in part. Our ESG engagement did not produce the desired results at 5 investee companies. One company was subsequently taken over and the positions in 3 other companies were closed.
Regarding the latter, for example, we had engaged with a small-cap US healthcare company that had gone public only a few years earlier on ESG matters over a period of 10 months. Various suggestions for improving corporate governance scores (management compensation and other areas) were made during the course of a constructive dialog. Collaborative engagement with a like-minded group of shareholders was also considered. Since our discussions with the company’s management were not fruitful either and we saw no grounds to expect an improvement in the company’s corporate governance in the foreseeable future, we decided to exit this position. We are confident that we made the right decision because the company’s MSCI ESG rating has not improved in the meantime. During the 2023 fiscal year, 20 new ESG engagements were initiated, and our portfolio management teams were involved in a total of 32 engagement processes. These pertained to the three pillars of sustainability – environmental, social and governance. As a substantial share of all investments are in companies within the US healthcare sector, most of the engagement activities also took place in that sector.
Breakdown of ESG engagements by sector in 2023

Breakdown of ESG engagements by region in 2023

Breakdown of ESG engagements by ESG criteria (multiple answers possible) in 2023

Selected ESG engagement case studies show that our portfolio managers and analysts are in very close contact with companies and through constructive dialog they endeavor to bring about the best possible corporate performance in terms of sustainability criteria too. Qualified opinions of third parties such as proxies are included in the process, although ultimately we always act in the interests of our investors.
Engagement Case: Example – Company from the Biopharma small-cap sector (USA)
Virtually every listed company is now aware of the high relevance of sustainability as part of its strategic agenda. Despite this increased awareness, organizations differ in their capacity to devote financial and human resources to sustainability issues. Again in 2023, some small caps lagged behind larger competitors on these issues.
Details of the engagement
With an MSCI ESG rating of B ( «laggard»), the company described here had a below-average sustainability rating at the initiation of our ESG engagement. The company lags behind competitors particularly in the area of talent retention. Given the organization’s reliance on highly qualified staff, difficulties in recruiting and retaining staff could pose challenges. Performance-related incentives or programs are essential in this industry in particular.
During a conference call with three company representatives (including Investor Relations & Human Resources), the responsible portfolio manager assessed priority and progress on sustainability, primarily focusing on the human capital issues criticized by MSCI ESG. The company says it has a bonus program to which all employees are entitled. The program rewards milestone achievements such as FDA approvals and contributes significantly to employee retention. Furthermore, all employees are granted shares as part of a stock option plan, allocated based on target achievement. Additionally, the company scores higher on employee satisfaction compared to the corresponding US peer group. We were told during the meeting about plans to raise visibility with relevant stakeholders (rating agencies, shareholders, etc.) and publish a sustainability report.
Outcome
We are monitoring further developments and taking potential progress into account in our investment decision. We anticipate that increased visibility would improve the ESG rating, which would be expected to have an overall positive impact on the organization.
Engagement case: Example – Husqvarna (Sweden)
The Swedish group is the world’s leading supplier of innovative products and solutions for forestry, park and garden maintenance, marketed under the global Husqvarna and Gardena brands. With an MSCI ESG rating of AA, Husqvarna has been an ESG leader for many years and is an international pioneer in sustainability management.
Details of the engagement
The Husqvarna Group reports annually on the progress of sustainability integration under the name «Sustainovate». The program’s sustainability targets are geared towards the year 2025. Our conversations with Husqvarna focused on: 1) the feasibility of the Sustainovate program 2) the progress made towards achieving their ambitious goals and 3) the importance of further enhancing the ESG rating, not just for a potential re-rating of stock valuation but for overall business development.
We had the opportunity to discuss the development of the Sustainovate program together with the Head of Investor Relations. It was highly gratifying to see that the company is well on the way to achieving its ambitious sustainability goals. With a 32% reduction in carbon across the entire value chain by 2022, Husqvarna is well on track to reach the targeted 35% reduction by 2025. That said, we emphasized the importance of publishing new sustainability targets soon. The current objectives are set for 2025, and we believe that shareholders and rating agencies would appreciate the company establishing a new set of ambitious sustainability targets (e.g., for 2027 or 2030) in 2024. This contributes to reinforcing the «best-in-class» reputation within the ESG landscape and further elevating the organization’s already commendable AA rating towards the coveted AAA rating.
Outcome
Husqvarna has not yet commented on specific new sustainability targets. The current focus is on achieving the Sustainovate 2025 program targets. We hope for new objectives upon the release of the sustainability report for the fiscal year 2023 and will remain in contact with Husqvarna in this regard.
Proxy voting
Bellevue also protects the long-term interests of its investors by making active use of its voting rights at the general shareholder meetings of investee companies through proxy voting.
International Shareholder Services (ISS) provides us with proxy advisory services. ISS has many years of experience in proxy advisory and sets the bar with its voting policies. However, there is no obligation to vote in the same way as ISS recommends. Bellevue may vote against the recommendations of third-party organizations if it deems that their voting recommendations are not in the best interests of investors. Bellevue Asset Management AG actively exercises its voting rights as a rule.
Voting rights can be exercised in person by attending a general meeting; electronically via online voting platforms or through an appointed representative or representatives / proxy voting firms.
Overview of voting activities in 2023
In 2023, our portfolio managers and analysts participated in 572 general meetings (2022: 583) and cast votes on 909 (898) of a total of 934 (910) possible proposals, which represents a participation rate of 97.3% (98.7%). This figure can be below 100% because some markets require an equity blocking period in connection with voting, which would in turn restrict trading in the securities concerned. In order to maintain portfolio liquidity, however, no voting takes place in such cases.
Detailed information on our voting activity is given in the following tables:
Meeting overview
2023 | 2022 | |||||
Category | Number | Percentage | Number | Percentage | ||
Number of votable meetings | 589 | 593 | ||||
Number of meetings voted | 572 | 97.1% | 583 | 98.3% | ||
Number of meetings with at least 1 vote against, withhold or abstain | 313 | 53.1% | 313 | 52.8% | ||
Ballot overview
2023 | 2022 | |||||
Category | Number | Percentage | Number | Percentage | ||
Number of votable ballots | 934 | 910 | ||||
Number of ballots voted | 909 | 97.3% | 898 | 98.7% | ||
Proposal overview
2023 | 2022 | |||||
Category | Number | Percentage | Number | Percentage | ||
Number of votable items | 7475 | 7069 | ||||
Number of items voted | 7127 | 96.6% | 6938 | 98.2% | ||
Number of votes FOR | 6060 | 85.0% | 5612 | 80.9% | ||
Number of votes AGAINST | 799 | 11.1% | 693 | 10.0% | ||
Number of votes ABSTAIN | 137 | 1.9% | 79 | 1.1% | ||
Number of votes WITHHOLD | 98 | 1.4% | 125 | 1.8% | ||
Number of votes on MSOP | 425 | 6.0% | 458 | 6.6% | ||
Number of votes with policy | 7059 | 99.1% | 6810 | 98.2% | ||
Number of votes against policy | 88 | 1.2% | 168 | 2.4% | ||
Number of votes with management | 6294 | 88.3% | 6060 | 87.4% | ||
Number of votes against management | 867 | 12.2% | 918 | 13.2% | ||
Number of votes on shareholder proposals | 147 | 2.1% | 120 | 1.7% | ||

Climate-change factors – CO2 emissions at portfolio level
The following environmental and climate-related portfolio evaluations refer exclusively to our investment strategies for listed securities (approx. 96% of total assets under management); private equity investments (approx. 3%) and derivatives-based strategies (approx. 1%) cannot be systematically assessed at the present time due to the lack of data and/or of viable methodological approaches.
In order to categorize financed carbon emissions, we have broken down invested assets by investment sector and investment region, as depicted below:
AuM by sector

AuM by country

As a highly specialized provider of healthcare investment solutions, approx. 94% of our investments are in the healthcare sector, 4% are in the manufacturing, consumer, tech, communications, and financial sectors, and only 2% are in the energy, commodities, utilities and real estate sectors. Three-quarters of the invested positions are domiciled in the US, European positions account for 4% of total investments and 7% is domiciled in Asia and emerging markets.
With respect to the TCFD, as of December 31, 2023, financed CO2 emissions – i.e., the CO2 emissions at the investment portfolio level – were systematically calculated for the first time. Using the PCAF method (Partnership for Carbon Accounting Financials, see box below for methodology), the respective Scope 1, Scope 2 and (largely estimated) Scope 3 emissions per portfolio position were recorded as of the reporting date using MSCI ESG data. The table below lists the calculated financed Scope 1, 2 and 3 emissions (absolute amount in million metric tons of CO2e) at portfolio level as of December 31, 2023, as well as the respective data quality score (Data Quality Score according to PCAF)3:
Financed GHG Emissions (t CO2e) | Scope 1 & 2 1) | Scope 3 2) | Data Coverage in % | PCAF Data Quality Score 3) Scope 1 & 2 | PCAF Data Quality Score 3) Scope 3 | |||||
BB Biotech AG | 4 872.65 | 64 415.44 | 97% | 3 | 4 | |||||
Bellevue African Opportunities | 4 458.90 | 14 711.90 | 75% | 2 | 2 | |||||
Bellevue AI Health | 11.83 | 341.94 | 97% | 2 | 2 | |||||
Bellevue Asia Pacific Healthcare | 1 175.40 | 7 496.60 | 99% | 2 | 3 | |||||
Bellevue Biotech (CH) | 139.40 | 1 526.60 | 89% | 3 | 3 | |||||
Bellevue Digital Health | 934.10 | 26 936.00 | 99% | 3 | 4 | |||||
Bellevue Diversified Healthcare | 68.70 | 1 571.70 | 97% | 2 | 2 | |||||
Bellevue Emerging Markets Healthcare | 377.40 | 2 117.20 | 95% | 2 | 3 | |||||
Bellevue Entrepreneur Europe Small | 1 581.00 | 24 818.50 | 95% | 2 | 3 | |||||
Bellevue Entrepreneur Europe Swiss Small & Mid | 698.50 | 16 004.60 | 90% | 2 | 3 | |||||
Bellevue Entrepreneur Switzerland (CH) | 893.30 | 19 471.00 | 90% | 2 | 3 | |||||
Bellevue Global Income | 2 184.90 | 5 232.00 | 44% | 2 | 2 | |||||
Bellevue Global Macro | 8 856.20 | 21 343.10 | 37% | 2 | 3 | |||||
Bellevue Healthcare Strategy (CH) | 1 164.40 | 18 844.70 | 98% | 2 | 3 | |||||
Bellevue Healthcare Strategy | 1 507.10 | 24 075.00 | 99% | 2 | 3 | |||||
WS Bellevue Healthcare Fund OEIC | 77.27 | 1 142.70 | 91% | 3 | 4 | |||||
Bellevue Healthcare Trust | 2 891.80 | 41 283.00 | 96% | 3 | 4 | |||||
Bellevue Medtech & Services (CH) | 216.30 | 8 751.30 | 100% | 2 | 3 | |||||
Bellevue Medtech & Services | 5 287.00 | 170 384.00 | 100% | 2 | 3 | |||||
Bellevue Obesity Solutions | 143.60 | 3 418.20 | 94% | 2 | 3 | |||||
Bellevue Option Premium | n/a | n/a | n/a | n/a | n/a | |||||
Bellevue Sustainable Entrepreneur Europe | 814.30 | 11 397.00 | 95% | 2 | 2 | |||||
Bellevue Sustainable Healthcare | 1 230.30 | 13 509.80 | 98% | 2 | 3 | |||||
StarCapital Dynamic Bond | 4 725.60 | 23 424.00 | 65% | 2 | 2 | |||||
StarCapital Multi Income | 6 500.00 | 36 643.00 | 65% | 2 | 3 | |||||
StarCapital Strategy 1 | 259.40 | 2 510.40 | 68% | 2 | 2 | |||||
Bellevue Institutional Mandates | 743.30 | 15 514.00 | 95% | 2 | 3 | |||||
Private Equity | n/a | n/a | n/a | n/a | n/a | |||||
Total | 51 812.65 | 576 883.68 |
1) Aggregate GHG emissions financed for Scope 1 and 2 (on the basis of EVIC). Based on reported emissions data when available. Otherwise estimated. Units: t CO2e. Calculated using MSCI ESG data inputs and methodology.
2) Aggregate GHG emissions financed for Scope 3 (on the basis of EVIC). Based on reported emissions data when available. Otherwise estimated. Units: t CO2e. Calculated using MSCI ESG data inputs and methodology.
3) PCAF Data Quality Score: Standardized measure for determining the data quality of the financed emissions; score 1 = highest quality/certain (reported and verified emissions of issuer in line with the GHG protocol); score 5 = lowest quality/uncertain (calculated based on emissions factors for the sector per unit of revenue). Calculated using MSCI ESG data inputs and methodology.
IMPORTANT NOTE: The given CO2 emissions must only be understood as abstract absolute amounts that will rise or fall as portfolio assets (AUM) increase or decline. Changes in portfolio assets, for example through subscriptions or redemptions of fund shares by investors, will have a significant impact on reported CO2 emissions. As such, this data is NOT suitable for comparative purposes, i.e., these figures cannot be used for historical or comparative contextual analysis, nor as KPI/target values.
In contrast, the CO2 footprint, i.e. the ratio of financed emissions (GHG Scope 1 and 2 and GHG Scope 3) to total invested assets, is more meaningful:
Financed emissions – CO2 footprint (in t CO2/mn CHF invested)

In addition to the financed emissions, the asset-weighted sum of aggregate CO2 intensity, i.e. total portfolio carbon emissions in metric tons per million USD of turnover (WACI Scope 1, 2, 3), has been calculated for each strategy:
CO2 intensity | WACI Scope 1, 2 & 3 1) | Data Coverage in % | Est. EU Taxonomy Alignment 2) | |||
BB Biotech AG | 374.93 | 97% | 0.0% | |||
Bellevue African Opportunities | 1 195.60 | 75% | 1.0% | |||
Bellevue AI Health | 367.55 | 97% | 0.9% | |||
Bellevue Asia Pacific Healthcare | 381.40 | 99% | 0.0% | |||
Bellevue Biotech (CH) | 292.50 | 89% | 0.0% | |||
Bellevue Digital Health | 824.90 | 99% | 0.5% | |||
Bellevue Diversified Healthcare | 365.60 | 97% | 0.1% | |||
Bellevue Emerging Markets Healthcare | 296.30 | 95% | 0.0% | |||
Bellevue Entrepreneur Europe Small | 679.70 | 95% | 11.1% | |||
Bellevue Entrepreneur Swiss Small & Mid | 542.40 | 90% | 1.3% | |||
Bellevue Entrepreneur Switzerland (CH) | 546.90 | 90% | 1.4% | |||
Bellevue Global Income | 985.30 | 51% | 3.5% | |||
Bellevue Global Macro | 577.30 | 41% | 1.4% | |||
Bellevue Healthcare Strategy (CH) | 384.70 | 98% | 0.0% | |||
Bellevue Healthcare Strategy | 385.30 | 99% | 0.0% | |||
Bellevue Healthcare Fund OEIC | 451.80 | 91% | 0.0% | |||
Bellevue Healthcare Trust | 468.30 | 96% | 0.0% | |||
Bellevue Medtech & Services (CH) | 533.60 | 100% | 0.0% | |||
Bellevue Medtech & Services | 810.41 | 100% | 0.0% | |||
Bellevue Obesity Solutions | 430.50 | 94% | 0.1% | |||
Bellevue Option Premium | n/a | n/a | n/a | |||
Bellevue Sustainable Entrepreneur Europe | 698.80 | 95% | 8.8% | |||
Bellevue Sustainable Healthcare | 374.40 | 98% | 0.0% | |||
StarCapital Dynamic Bond | 705.80 | 77% | 5.9% | |||
StarCapital Multi Income | 736.40 | 72% | 4.7% | |||
StarCapital Strategy 1 | 585.82 | 75% | 3.3% | |||
Bellevue Institutional Mandates | 370.80 | 95% | 0.1% | |||
Private Equity | n/a | n/a | n/a | |||
Asset weighted average | 528.31 |
1) GHG emissions in tons per million dollars of turnover for Scope 1, 2 and 3 emissions. Based on reported emissions data, if available, otherwise estimated emissions; units: metric tons of CO2e / 1 million of revenues in the portfolio base currency. Calculated using MSCI ESG data inputs and methodology.
2) Estimated EU Taxonomy Alignment: Estimated maximum percent of weighted-average investee turnover that makes a substantial contribution to one or more of the EU Taxonomy’s climate or environmental objectives without having a significant adverse impact on the other objectives and that is also in compliance with minimum human and labor rights. Calculated using MSCI ESG data inputs and methodology.
The Bellevue African Opportunities Fund and the Bellevue Global Income Fund are Bellevue’s most carbon-intensive investment funds. Both invest in energy and mining companies, two industries with the highest amounts of CO2 emissions. Healthcare funds, in contrast, have lower if not the lowest CO2 intensities. Examples here are the Bellevue Biotech (CH), Bellevue Sustainable Healthcare and Bellevue Healthcare Strategy funds as well as BB Biotech AG. The Bellevue Emerging Markets Healthcare Fund also has a very low carbon of 292 t CO2/USD 1 mn turnover, which reflects the high weighting of healthcare services providers on the one hand and the in some case still moderate estimates of Scope 3 emissions on the other. The diversified healthcare strategies are therefore all within the range of the MSCI World Healthcare Index, which had a CO2 intensity of 361.9 t CO2/USD 1 mn turnover as of December 31, 2023.
By comparison, the Entrepreneur funds, the Bellevue Global Macro Fund and the StarCapital funds invest in a wide range of industries, including the energy and manufacturing industries, and therefore have higher average intensities than the healthcare strategies.
With 528.3 t CO2/USD 1 mn turnover for all measurable Bellevue investment strategies (approx. 94% of Bellevue’s total AUM), the CO2 intensity or WACI Scope 1, 2, 3, is approximately 42% below the calculated carbon intensity of the index-weighted constituents of the MSCI AC World Index (905.9 t CO2/USD 1 mn turnover).
With reference to the alignment of Bellevue’s investment strategies with the EU Taxonomy’s climate and environmental objectives, the Bellevue Entrepreneur Europe Small Fund and the Bellevue Sustainable Entrepreneur Europe Fund have the highest taxonomy alignment scores at around 11% and 9%, respectively, of weighted-average company revenue. The StarCapital Dynamic Bond Fund (6%) and the StarCapital Multi Income Fund (just under 5%) also make moderate contributions to the environmental objectives of the EU Commission. Based on the total assets under management of Bellevue, the share of weighted-average turnover that meets at least one of the EU Taxonomy environmental and climate objectives is around 0.4%. This is mainly due to the fact that 94% of our investments are in the healthcare sector, which, by its very nature, cannot make a substantial contribution to any of the 6 environmental objectives of the EU Taxonomy (the weighted-average turnover within our EU Taxonomy-aligned healthcare investments is 0.04%; of the almost 300 healthcare investees, a mere 8 meet the applicable Taxonomy requirements to substantially contribute to at least one of the EU Taxonomy’s environmental objectives and their level of alignment is very low).
We therefore again emphasize that our investment strategies seek to provide long-term capital growth by investing in companies with positive sustainable characteristics. None of our investment strategies has specified a minimum proportion of portfolio investment in environmentally sustainable economic activities as defined in Article 3 of the EU Taxonomy Regulation (2020/852). The EU Taxonomy-aligned turnover data above is for informational purposes only.
PCAF methodology (Partnership for Carbon Accounting Financials):
The financed emissions of a loan or an investment in a company are determined by multiplying the attribution factor by the emissions of the borrower or investee. Total funded emissions of a portfolio of listed equities and corporate bonds are calculated as follows:

The attribution factor represents the proportional share of a given company, i.e., the outstanding amount divided by EVIC for listed equity or the outstanding amount divided by total equity and debt for traded bonds to private companies:

The financed emissions from listed equity and corporate bonds can be calculated in different ways depending on the availability of financial and emissions data specific to the borrower and investee: Overall, PCAF distinguishes three different options to calculate the financed emissions from listed equity and corporate bonds depending on the emissions data used: Option 1: Reported emissions (verified/unverified); Option 2: emissions are estimated based on data collected from the borrower or investee company; Option 3: emissions are estimated based on sector-specific average emissions per economic activity.
The definitions of the PCAF data quality scores for listed equities and corporate bonds are as follows:

Source: Financed Emissions, The Global GHG Accounting & Reporting Standard, PCAF Partnership for Carbon Accounting Financials, December 2022
As mentioned in the section on ESG integration/PAI indicators above, carbon emissions data is used to determine sustainability scores, either implicitly based on the MSCI ESG rating, which is relevant for calculating the proportional share of investments that promote sustainable characteristics, or explicitly based on the reported carbon intensity of each issuer. The reported figure is checked to see if the carbon intensity threshold exceeds 70 t CO2/USD mn revenue (i.e., is higher than the «low» range used in MSCI ESG methodology). If yes, it is compared against the relevant industry average. If the reported value of the issuer is found to exceed 50% of the given sector average, the issuer cannot be categorized as a «sustainable investment», even if it makes a positive contribution to one or more of the 17 UN SDGs.
Using this methodology, there were a total of 8 issuers (or 0.1% of total assets under management) in all of Bellevue's portfolios as of the end of 2023 whose CO2 intensity scores were categorized as non-sustainable.
In addition, according to MSCI ESG Research, 30 issuers or 0.4% of total assets under management, were lacking carbon emission reduction measures.
Greenhouse gas emissions and the CO2 footprint are also fundamental components of a company's MSCI ESG rating and are thus indirectly included in the assessment and weighting of sustainable investments.
With regard to investments in companies in high-carbon industries (oil, gas, coal), these investments accounted for 0.19% of total assets under management at year-end (0.22% in the previous year).
Comeback for infrastructure investments – sustainable investment opportunities
Renewable energy, energy security, electrification, and deglobalization are some of the biggest challenges the world faces today and they can only be met through massive government as well as private-sector investment programs, which have already been initiated in various developed countries. From an investor’s perspective, the dynamics and the scale of these developments offer a wide range of investment opportunities, and that is also true to Swiss and other European companies. For Bellevue as a fundamentally oriented stockpicker, the global transformation of infrastructure is a key factor in the positioning of Bellevue’s Entrepreneur Funds. Whether it be compressor systems from Switzerland, green storage solutions for renewable energy from Finland or offshore winds from Norway – the opportunities are vast and compelling from an environmental-sustainable standpoint as well as from a business standpoint.
KPIs of responsible investments
Target | 2023 | 2022 | ||||
ESG Coverage as % of AuM at year-end | >90% | 97.1% | 96.5% | |||
Investments with sustainable characteristics as % of AuM at year-end | >75% | 94.0% | 87.1% | |||
Sustainable investments as % of AuM at year-end | >25% | 61.0% | 54.3% | |||
Reduction in the sustainability rate due to supercritical PAI values | – | 7.7% | n/a | |||
Number of processed engagements in the calendar year | – | 32 | 22 | |||
Exercise of voting rights in % of the proposals eligible for voting | >90% | 97.0% | 98.0% | |||
Asset-weighted GHG intensity (WACI Scope 1, 2, 3) of total assets at the end of the year | – | 528.3 t CO2< | n/a | |||
Investments in the carbon sector as % of AuM at year-end | – | 0.2% | 0.2% |